Graphing calculators are useful tools for solving mathematical problems, studying functions, and understanding how equations appear visually. However, sometimes a graph does not display correctly because of incorrect settings, an unusual viewing window, or previously entered functions. Knowing how to reset these settings can make working with graphs much easier. 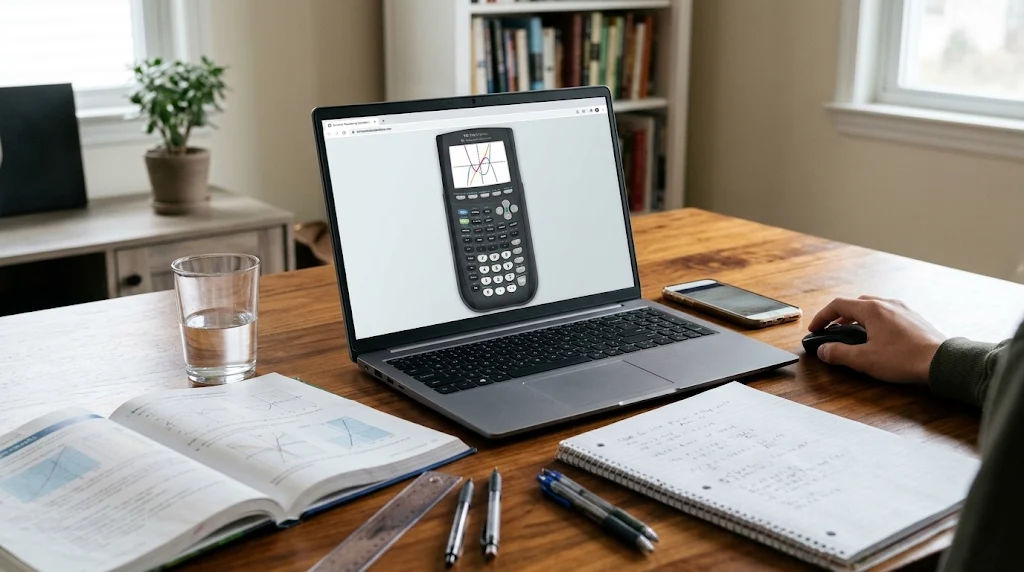 If you are using a TI84 Calculator Online, understanding the available reset options can help you restore the graph display without starting your calculations from scratch.
Resetting a graph does not always mean clearing everything stored in the calculator. In most situations, you only need to adjust the graph window, remove unwanted functions, or restore the standard graph settings. Choosing the correct reset method helps prevent unnecessary changes to your saved work.
This comprehensive guide explains how to reset a graph on a TI-84 calculator online, which settings you should check, how to solve common graphing problems, and how to avoid losing important calculations.
Graph Reset Function
Before resetting a graph, it is important to understand what the reset function does. A graphing calculator contains several settings that control how mathematical functions appear on the screen.
These settings include:
-
X-axis and Y-axis ranges.
-
Graphing window dimensions.
-
Function equations.
-
Zoom settings.
-
Graph display options.
-
Coordinate grid settings.
When one or more settings are incorrect, the graph might appear too large, too small, incomplete, or completely outside the visible screen.
Resetting the graph helps restore a useful viewing area and makes it easier to examine mathematical functions.
Why Would You Need to Reset a Graph?
There are several reasons students may need to reset their graphing calculators.
For example, you might accidentally zoom in too far while examining a function. This can make the graph appear extremely large, with only a small section visible.
Another common problem happens when the X-minimum and X-maximum values are changed. If the viewing window does not include the important coordinates, the graph may seem to disappear.
You may also have entered several equations and want to remove them before working on a new assignment.
Understanding the source of the problem helps you choose the right reset option.
How to Reset a Graph on TI84 Calculator Online
The process depends on the online calculator or emulator you are using. Many online TI84 Calculator Online style provide controls similar to the physical TI-84 device.
Follow these general steps to restore your graph.
Step 1: Open the Online Calculator
Start by opening your preferred online TI-84 calculator in your browser.
Allow the calculator interface to load completely. Depending on the platform, you may see a virtual calculator with buttons, a graphing screen, or a larger workspace.
Make sure you can access the graphing and window settings.
Some online calculators reproduce the original TI-84 interface, while others organize the same features differently.
Step 2: Open the Graphing Screen
Find the graphing option on the calculator.
On a standard TI-84, pressing the GRAPH button displays the graph of the currently selected functions.
If you have entered an equation such as:
[ Y_1=X^2 ]
the calculator should display a parabola.
However, if the graph is not visible, the problem may be related to the viewing window rather than the equation itself.
Step 3: Open the Window Settings
On a standard TI-84 calculator, press the WINDOW button.
This opens the settings that control the visible coordinate area.
You will usually find settings such as:
-
Xmin: Minimum horizontal coordinate.
-
Xmax: Maximum horizontal coordinate.
-
Xscl: Horizontal scale.
-
Ymin: Minimum vertical coordinate.
-
Ymax: Maximum vertical coordinate.
-
Yscl: Vertical scale.
These values determine which section of the coordinate plane appears on the graphing screen.
Step 4: Restore Suitable Window Values
If your graph looks unusual, check whether the coordinate limits are reasonable.
For example, a standard viewing window can use the following values:
|
Setting |
Example Value |
|---|---|
|
Xmin |
-10 |
|
Xmax |
10 |
|
Xscl |
1 |
|
Ymin |
-10 |
|
Ymax |
10 |
|
Yscl |
1 |
These settings display a coordinate area extending from -10 to 10 on both axes.
Enter the appropriate values using your calculator's interface.
After changing the settings, return to the graphing screen and check whether the function appears correctly.
Step 5: Use the Standard Zoom Option
Another convenient method is using the ZOOM menu.
On a standard TI-84, press ZOOM to access different viewing options.
Choose Zoom Standard, commonly listed as option 6.
This restores the standard viewing window and is often the quickest solution when a graph disappears because of incorrect zoom settings.
Remember that resetting the viewing window does not necessarily delete your equations.
Different Methods for Resetting a Graph
Not every graphing problem requires the same solution. The best approach depends on what you want to restore.
Using Zoom Standard
Zoom Standard is one of the easiest ways to restore a normal graph display.
It returns the coordinate window to standard values, making it useful when:
-
The graph appears too large.
-
The graph looks extremely small.
-
You cannot find the function.
-
You have zoomed in or out too many times.
-
The viewing area has become confusing.
This option is especially useful for students who regularly switch between different mathematical functions.
Using ZoomFit
ZoomFit is another helpful option available on standard TI-84 models.
It adjusts the vertical viewing window based on the selected function and the horizontal viewing range.
For example, suppose you are graphing:
[ Y_1=X^2 ]
If the current window does not show the full curve, ZoomFit may adjust the vertical range to make the graph easier to examine.
However, ZoomFit does not work exactly like a complete calculator reset. It changes the viewing area to fit the selected graph.
Adjusting the Window Manually
Sometimes automatic zoom options do not provide the view you need.
In this situation, manually changing the window settings gives you more control.
For example, if you are studying a quadratic function and need to examine a particular section, you can adjust the X-axis and Y-axis limits.
Manual adjustment is useful when working with:
-
Quadratic equations.
-
Linear functions.
-
Exponential functions.
-
Trigonometric graphs.
-
Polynomial equations.
It also helps students understand how coordinate ranges influence the appearance of mathematical functions.
How to Clear Unwanted Graph Functions
Sometimes the graph does not reset because unwanted equations are still stored in the function editor.
A TI-84 calculator allows users to enter several functions simultaneously. If multiple equations are selected, they may appear together on the graphing screen.
Open the Function Editor
On a standard TI-84, press the Y= button.
This opens the function editor, where entered equations are displayed.
For example:
[ Y_1=X^2 ]
[ Y_2=2X+3 ]
[ Y_3=X^3 ]
All three functions may appear when graphing is enabled.
Remove Unwanted Equations
If you want to display only one function, move to the equation you no longer need and clear its contents.
You can also turn individual functions off using the selection controls provided by the calculator.
This is better than performing a complete reset because it allows you to keep equations that are still useful.
Check Which Functions Are Enabled
A function may remain stored without being displayed.
Check the selection indicator beside each equation. Make sure the functions you want to study are enabled.
This simple step can solve many graphing problems without changing other calculator settings.
How to Reset Graph Settings Without Deleting Calculations
One important thing students should understand is the difference between resetting graph settings and resetting the entire calculator.
These actions are not identical.
A graph window reset changes how the coordinate plane is displayed. Clearing functions removes selected equations. A complete calculator reset may affect additional settings and stored information.
If you only want to fix the graph, avoid using the complete memory reset option.
Protect Your Existing Work
Before changing calculator settings, consider whether you have entered equations or stored important calculations.
If you are using an online calculator, check whether the platform provides a save feature.
Some browser-based calculators automatically preserve information during a session, while others may clear temporary data when the page is refreshed.
Keeping a separate record of important equations is a sensible precaution.
Understand the Difference Between Reset Options
The following comparison explains the main differences.
|
Reset Method |
Main Purpose |
|---|---|
|
Zoom Standard |
Restores standard graph viewing limits |
|
ZoomFit |
Adjusts the window to fit selected functions |
|
Manual Window Reset |
Lets you enter custom coordinate limits |
|
Clear Functions |
Removes unwanted equations |
|
Complete Calculator Reset |
Restores broader calculator settings |
For most ordinary graph display problems, Zoom Standard or manual window adjustment is sufficient.
Common Problems When Resetting a TI84 Graph Online
Even after changing graph settings, you may experience problems. Understanding their possible causes can help you find the correct solution.
The Graph Still Does Not Appear
If the graph remains invisible, first check whether a function has actually been entered.
For example, entering:
[ Y_1=2X+1 ]
should produce a straight line.
Next, make sure the function is enabled and that the coordinate window includes the expected graph.
Also check whether the equation contains a typing error.
The Graph Appears Outside the Screen
This problem usually happens when the viewing window has unsuitable coordinate limits.
For example, if Xmin and Xmax are both positive, a graph located mainly in the negative coordinate region may not appear.
Using Zoom Standard can help restore a more balanced viewing area.
The Graph Looks Too Small
A graph may appear too small when the viewing window covers a very large coordinate range.
For example, displaying values from -1,000 to 1,000 can make smaller mathematical changes difficult to see.
Reduce the viewing range or use Zoom Standard.
The Graph Looks Distorted
Incorrect horizontal and vertical scales can make a graph look unusual.
Check Xscl and Yscl to ensure the coordinate markings are suitable.
You should also check whether the equation itself produces the shape you expect.
The Online Calculator Is Not Responding
Sometimes the problem is related to the browser rather than the calculator settings.
Try the following general troubleshooting steps:
-
Wait for the calculator to finish loading.
-
Check your internet connection.
-
Refresh the calculator page if your work has been saved.
-
Reopen the calculator if the interface becomes unresponsive.
-
Try another supported browser if the problem continues.
Avoid refreshing the page before saving important equations or calculations.
Tips for Using TI84 Calculator Online More Effectively
Learning how to reset a graph is useful, but developing good graphing habits can prevent many problems.
Start With a Simple Equation
When testing the graphing screen, begin with an easy equation such as:
[ Y_1=X ]
This should produce a straight line through the origin.
If it appears correctly, you can move on to more complicated functions.
Use Appropriate Coordinate Ranges
Different equations require different viewing windows.
A linear function may be easy to understand using a standard window, while an exponential function might require a larger vertical range.
Choose coordinate limits that display the important features of the function.
Avoid Changing Too Many Settings at Once
If a graph does not appear correctly, change one setting at a time.
For example, check the X-axis range before adjusting the Y-axis range.
This makes it easier to identify the actual cause of the problem.
Learn the Main Calculator Buttons
Students should become familiar with important TI-84 controls, including:
-
GRAPH for displaying functions.
-
Y= for entering equations.
-
WINDOW for adjusting coordinate limits.
-
ZOOM for selecting viewing options.
-
TRACE for examining coordinates.
-
TABLE for viewing function values.
Understanding these buttons makes graphing more straightforward.
Practice With Different Functions
Try graphing linear, quadratic, and exponential functions.
Compare how each function appears under different viewing settings.
This practice helps you understand the relationship between mathematical equations and their visual representations.
Why Resetting a Graph Is Important for Students
Graphing is an important part of high school mathematics, especially in algebra, precalculus, and introductory calculus.
Students use graphs to understand how equations behave and how mathematical relationships change.
However, incorrect graph settings can make an otherwise correct equation difficult to understand.
Knowing how to reset the graph helps students spend less time troubleshooting and more time learning.
Better Understanding of Mathematical Functions
A properly displayed graph makes it easier to identify important features.
For example, students can examine where a function crosses an axis, how its shape changes, and whether it increases or decreases.
These observations can support their understanding of mathematical concepts.
More Efficient Homework Practice
When working through several assignments, students may need to graph many different equations.
Resetting the viewing window between problems helps create a clear starting point.
It also reduces confusion when moving from one function to another.
Greater Confidence With Digital Calculators
Online calculators provide convenient access to mathematical tools through a browser.
Learning their controls helps students become more comfortable with digital problem-solving.
With regular practice, adjusting graph settings becomes a simple part of the normal graphing process.
Conclusion
Resetting a graph on a TI-84 calculator is a straightforward process once you understand the available settings and their purposes. In most cases, you do not need to reset the entire calculator to fix a graph display problem. Using Zoom Standard, adjusting the viewing window, or clearing unwanted functions can usually restore the graph to a useful condition.
When working with a TI84 Calculator Online, begin by checking the graphing screen and identifying what is causing the problem. If the graph is too large, too small, or missing, examine the coordinate limits and try the standard zoom option. If unwanted equations are appearing, open the function editor and remove or disable the functions you no longer need.
It is also important to understand the difference between resetting graph settings and clearing the calculator's memory. A complete reset can affect more information than necessary, so always choose the simplest solution that addresses the issue.
Students should practice using the GRAPH, Y=, WINDOW, and ZOOM functions to become familiar with the calculator interface. They should also experiment with different equations and coordinate ranges to understand how graph settings influence mathematical displays.
Ultimately, knowing how to reset a graph makes online calculator use more efficient and helps students focus on understanding mathematics rather than struggling with technical settings. With the right approach, you can restore your graph, organize your equations, and continue solving mathematical problems with confidence.